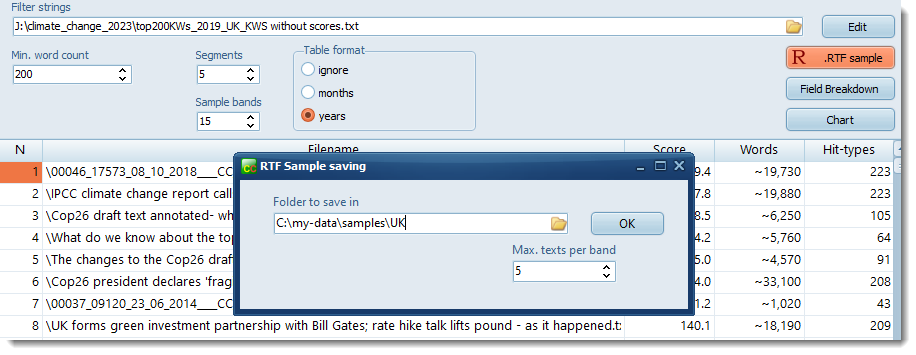
The idea is to save a sample of texts in RTF format with colours to show the source text and how many filter terms it has.
You'd normally want to find a suitable cut-off point, above which you can simply filter relevant texts out elsewhere.
Example
With this chart of climate change data, the highest scores will almost certainly be relevant and those scoring low are very likely to be irrelevant.
Here I chose to sample all the scores into 15 bands with 5 texts in each band.
That produced a set of 15 folders.
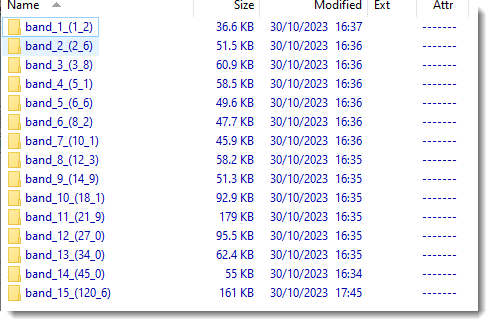
Band 15 has a sample of 5 texts scoring around 120.6
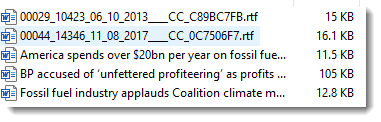
Now it's easier to read a sample of texts in the various bands to decide where to make a cut-off.
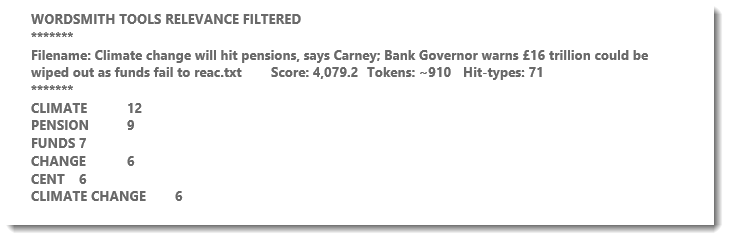
The results look like this (here showing in Microsoft Word):
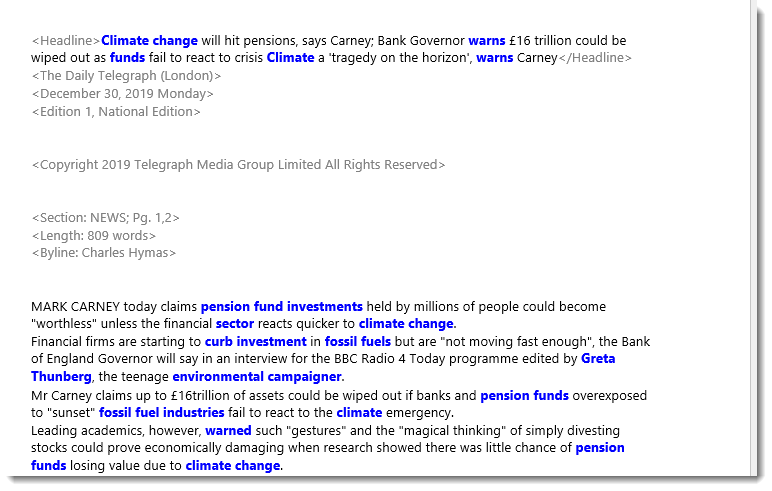
Headers are greyed out, all filter terms are highlighted. Below the text itself appear relevant score details.
See also: Relevance check, Charts, Search-term table, See the text