If you press the Chart button you will initially see how the scores distribute.
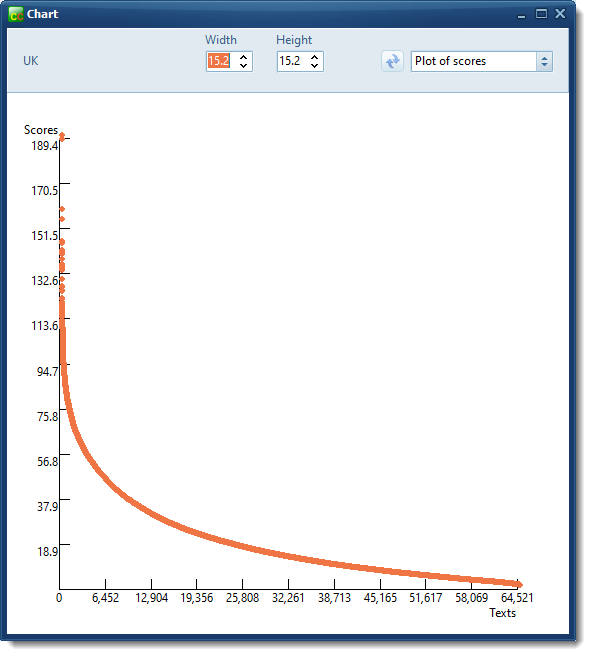
Here the top score is 189.4 that is scored by the very first text. The last text (number 64,521) scored zero points.
Histogram display
If you change the option to Histogram, you get this:
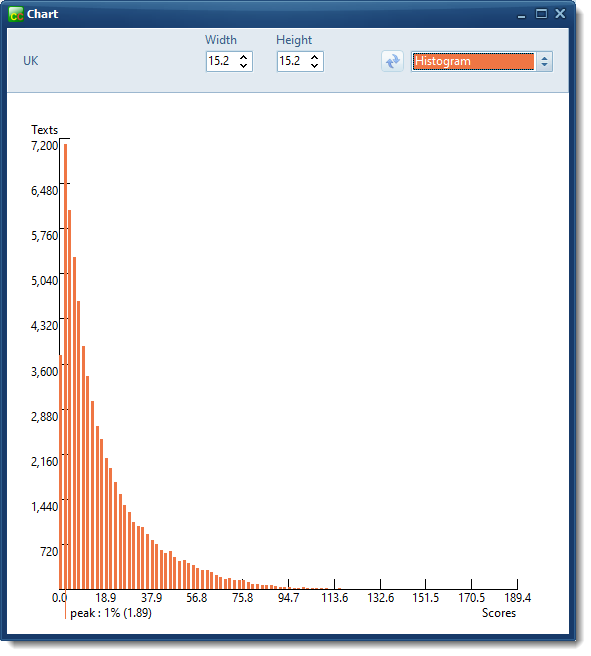
There are 100 bars. The leftmost bars peak at 1%. Above scores of 100 there are almost no texts. Most texts scored low with the filter strings selected.
Breakdown into bands
Here the texts are split into a number of bands with for these data about 4,300 texts in each band. The top band (15) represents texts scoring between 52 and 189.4 and contains 6.7% of the texts.
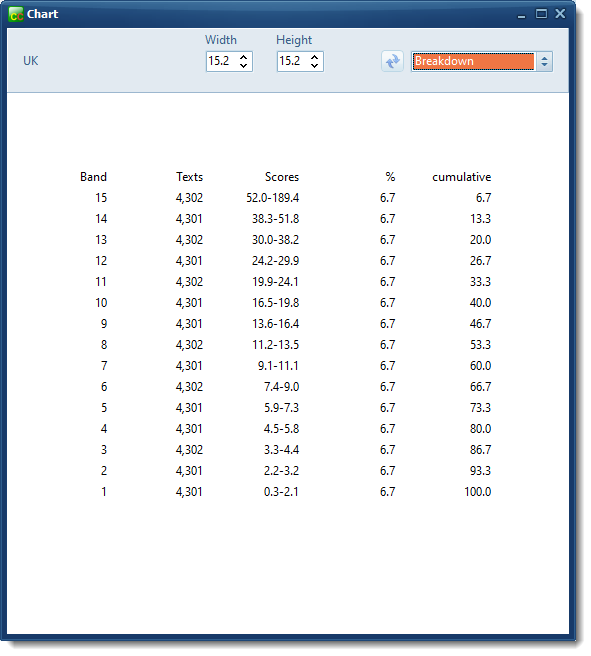
You will possibly be wanting to filter out some texts. If you wanted to keep 80% of them you could move those scoring less than 5.8.