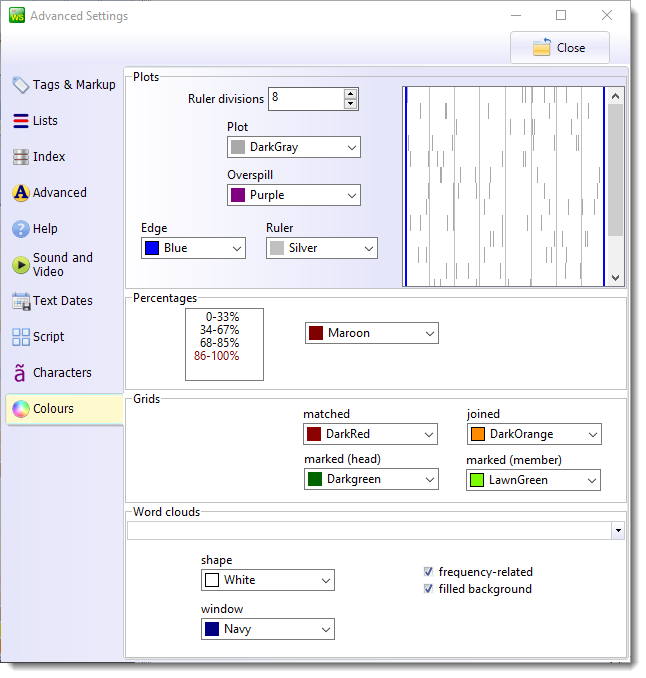
Plot colours
The margins are set using Edge colour, plot lines use Plot colour and, where there is overlap, Overspill colour. Data overspill: for example you have 10,000 words in the text file, and there are hits at word 990 and 1000 and 1010. If your screen width for the plot is 1000 pixels, these hits would just be shown at pixel 99, 100 and 101. If the text was 11,000 words long, however, they'd overlap.
The vertical ruler mark are shown above (default = silver).
Percentages
You can get set these colours to bring out particular ranges in your data. For example:
Grids
These are the colours seen in the left margin of a grid where you have a match, joined data or you have marked an entry.
Word Clouds
These settings allow to to choose how each word will be displayed, e.g. within rectangles or circles. The colours of the words and the word cloud window are set in the List colours section above. If you choose frequency-related colours the colours vary according to each word's frequency. Filled background shows a coloured background if you have no shape (just the word) selected.