WordSmith Tools Help
The columns to the left of the time-line itself (word, hits etc.) sort simply by pressing the header.
Sorting the time-line
When you sort a time line you might want to re-sort the time period plots. Click the header bar in the Timeline section.
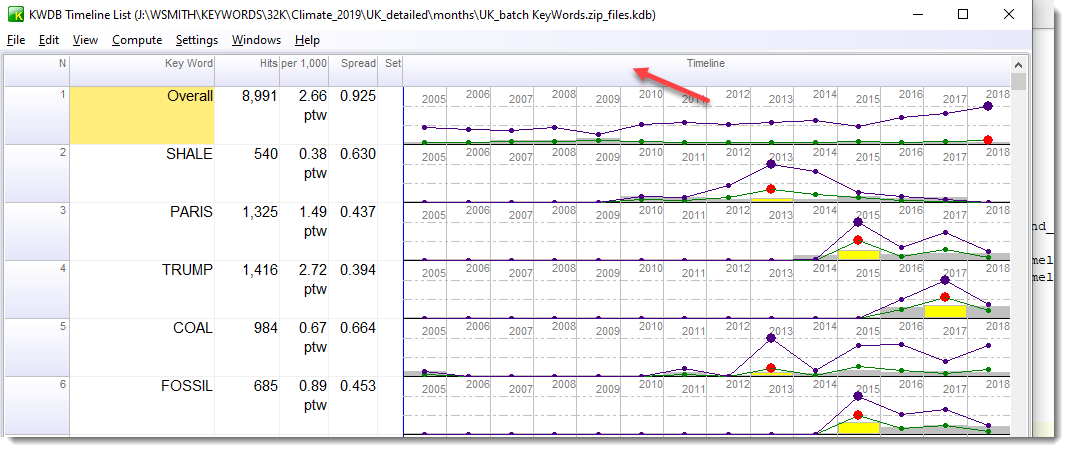
This Key word database time-line shows how terms like shale, coal, fossil and Paris, Trump etc. are found in a set of climate change data. Shale and coal are more prominent in 2013, Trump in 2017.
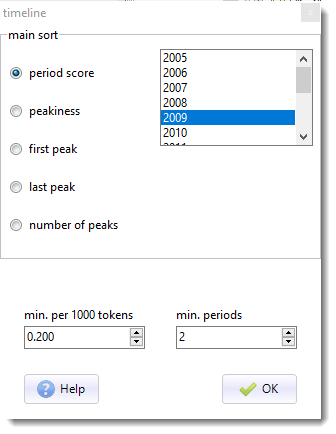
A click on the header bar offers this:
what is a peak?
See peak definition.
period score
The window offers a list of the time-line periods your data offers. Pressing OK with a date sort will arrange the data so as to bring to the top all the cases where the peaks are highest in that period of time.
first peak, last peak
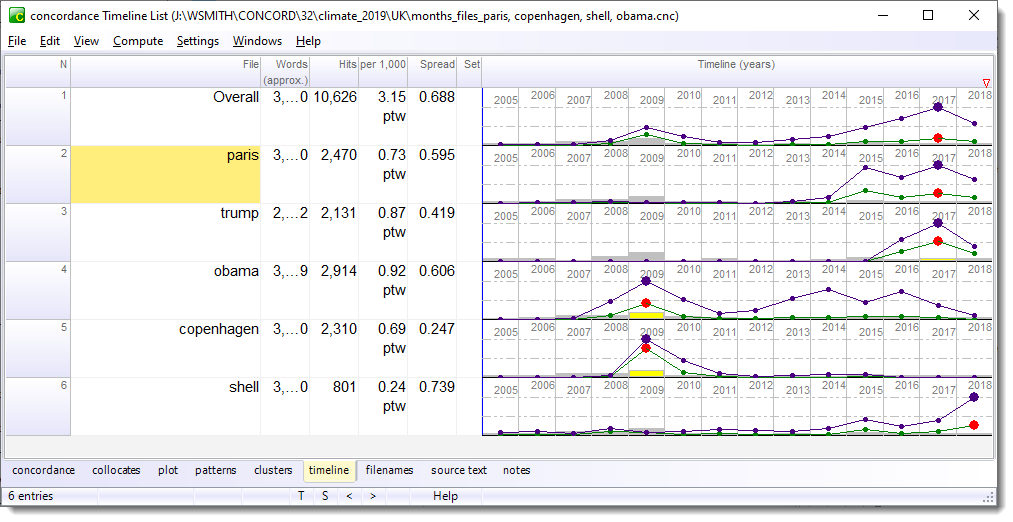
Sort by when the first or last hits appear. In the data shown below, Paris has peaks in 2015,2016,2017,2018. Obama in 2009, 2014, 2016. Trump peaks in 2016 & 2017, Copenhagen in 2009 and 2010, Shell in 2018.
number of peaks
Counts peaks and sorts on the number in each entry.
peakiness
This measures the sum of any peaks. Paris has 4 peaks, Trump has 2 high ones, Obama 3 but lower. Shell (oil) is the least peaky.
Or use the Set column to sort
In order to set your own sort criteria, simply use the Set column for example inserting a letter or number to some items and then sorting by clicking the Set header.
See also: merging time-lines, time-line settings, setting times and dates.