The point of it…
This function brings up a calculator, where you can choose functions to calculate values which interest you. For example, a word list routinely provides the frequency of each type, and that frequency as a percentage of the overall text tokens. You might want to insert a further column showing the frequency as a percentage of the number of word types, or a column showing the frequency as a percentage of the number of text files from which the word list was created.
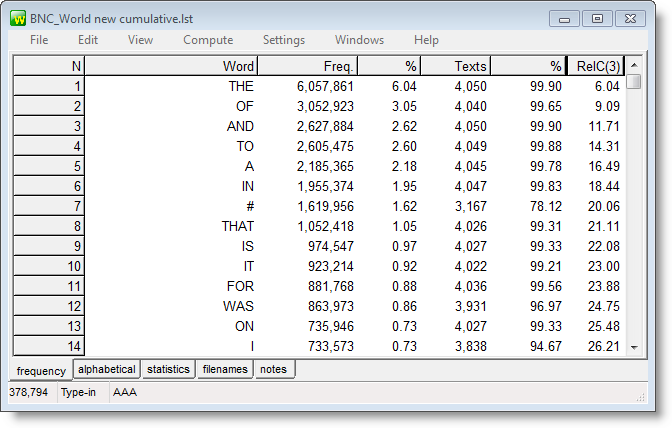
This word-list has a column which computes the cumulative scores (running total of the % column).
 How to do it
Just press Compute | New Column and create your own formula. You'll see standard calculator buttons with the numbers 0 to 9, decimal point, brackets, 4 basic functions. To the right there's a list of standard mathematical functions to use (pi, square root etc.): to access these, double-click on them. Below that you will see access to your own data in the current list, listing any number-based column-headings. You can drag or double-click them too.
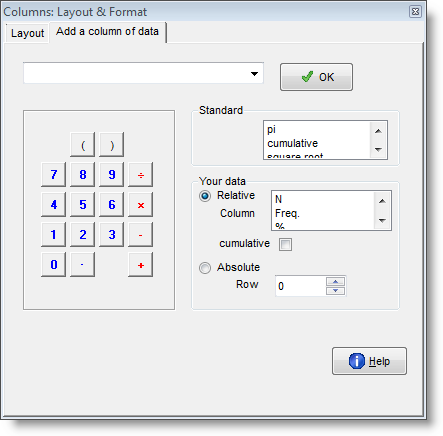
Absolute and Relative
Your own data can be accessed in two ways. A relative access (the default) means that as in a spreadsheet you want the new column to access data from another column but in the same row. Absolute access means accessing a fixed column and row.
Examples
you type
|
Result -- for each row in your data, the new column will contain:
|
Rel(2) ÷ 5
|
the data from column 2 of the same row, divided by 5
|
RelC(2)
|
the data from column 2 of the same row, added to a running total
|
Rel(3) + (Rel(2) ÷ 5)
|
the data from column 2 of the same row, divided by 5, added to the data from column 3 of the same row
|
Abs(2;1) ÷ 5
|
the data from column 2 of row 1, divided by 5. (This example is just to illustrate; it would be silly as it would give the exact same result in every row.)
|
Rel(2) ÷ Abs(2;1) × 100
|
the data from column 2 of the same row divided by column 2 of row 1 and multiplied by 100. This would give column 3 as a percentage of the top result in column 2. For the first row it'd give 100%, but as the frequencies declined so would their percentage of the most frequent item.
|
You can format (or even delete) any variables computed in this way: see layout.
|
See also: count data frequencies, column totals, colour categories, add a Set column

