The point of it...
This function allows you to see a total and some basic statistics on each column of data, if the data are numerical.
How to do it
With a word-list, index, concordance or key-words list visible, choose the menu item View | Column Totals to switch column totals on or off.

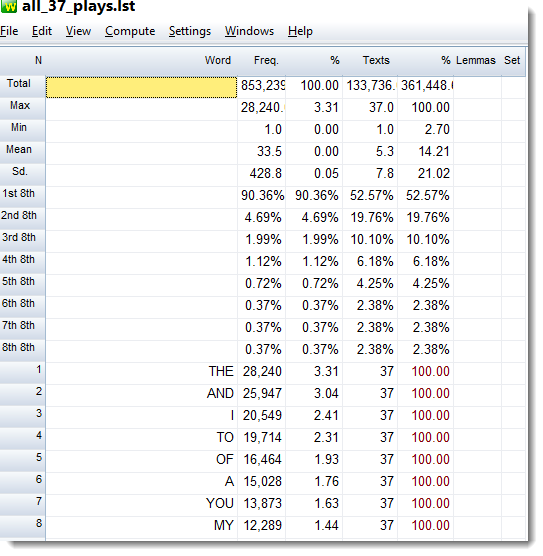
This view shows the frequency list of Shakespeare plays with column totals. In the % column we see that the maximum was 3.31%. In other words, the top frequency word (THE) takes up 3.31% of the running words in these plays. The mean Freq. is 33.5 and the mean number of plays is 5.3. In other words the average word in this set of data crops up in about 5 of the Shakespeare plays. The first eighth of these words in the frequency list (i.e. the most frequent 12.5%) take up 90.36% of the words altogether. In the Texts column you see 52.57% which means that the total number of plays over all the words are split up 52.57% in the first eighth only 2.38% in the most infrequent words.
Eighths?
The divisions into 8ths are dependent on your plot ruler divisions.
See also: compute additional columns, add a Set column, save as Excel
