Dispersion Plot (![]() )
)
|
Dispersion Plot ( |
Top Previous Next |
|
Concord > Concord: dispersion
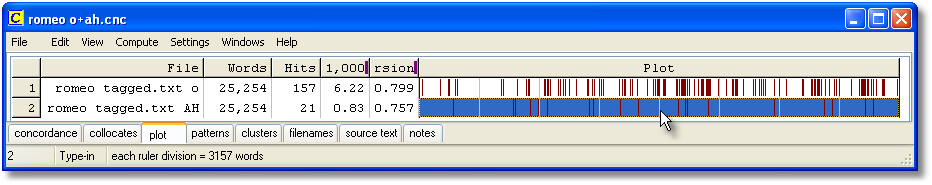
The point of it This shows where the search word occurs in the file which the current entry belongs to. That way you can see where mention is made most of your search word in each file.
What you see The plot shows: File source text file-name Words number of words in the source text Hits number of occurrences of the search-word per 1,000 how many occurrences per 1,000 words Dispersion the plot dispersion value Plot a plot showing where they cropped up, where the left edge of the plot represents "Once upon a time" and the right edge is "happily ever after".
Here we see a plot of "O" and another of "AH" from the play Romeo and Juliet. They are on 2 separate lines because there were 2 search-words. There are more "O" exclamations than "AH"s. There is a "ruler" splitting the display into 8 segments, and the status bar tells us each segment represents about 3150 running words of the play.
The plot is initially sorted by no. of words per 1,000. There are two ways of viewing the plot, the default, where all plotting rectangles are the same length, or Uniform Plot (where the plot rectangles reflect the original file size -- the biggest file is longest). Change this in the View menu at the top.
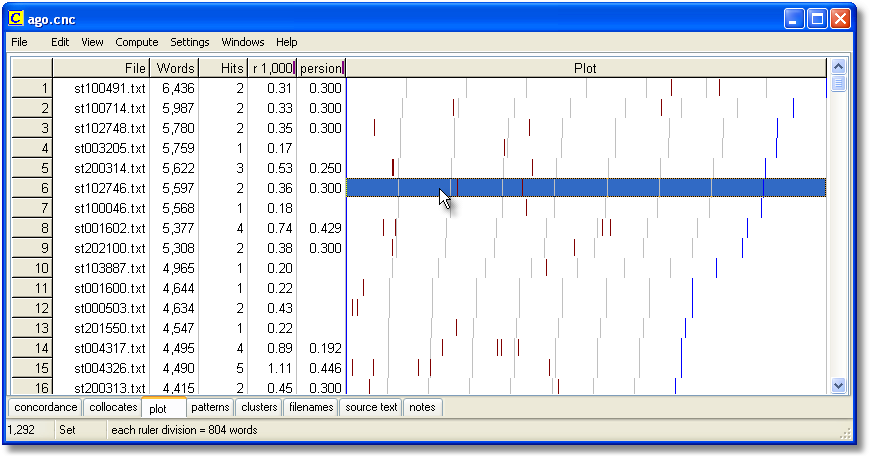
The screenshot shows "uniform plot" -- as the statusbar says, each ruler segment represents 800 words in these dispersion plots of "ago". If you look at the Words column, you will see that the number of words in each file varies, which is why the blue right plot edge and the ruler marks vary in position.
If you don't see as many marks as the number of hits, that'll be because the hits came too close together for the amount of screen space in proportion to your screen resolution. You can stretch the plot by dragging the top right edge of it. You can export the plot using Save As and can get your spreadsheet to make graphs etc, as explained here.
Each plot window is dependent on the concordance from which it was derived. If you close the original concordance down, it will disappear. You can Print the plot. There's no Save option because the data come from a concordance which you should Save, or Print to File. You can Copy to the clipboard (Ctrl-Ins) and then put it into a word processor as a graphic, using Paste Special.
See also: plot and ruler colours, plot dispersion value. |