When you first see your report it may look like this:
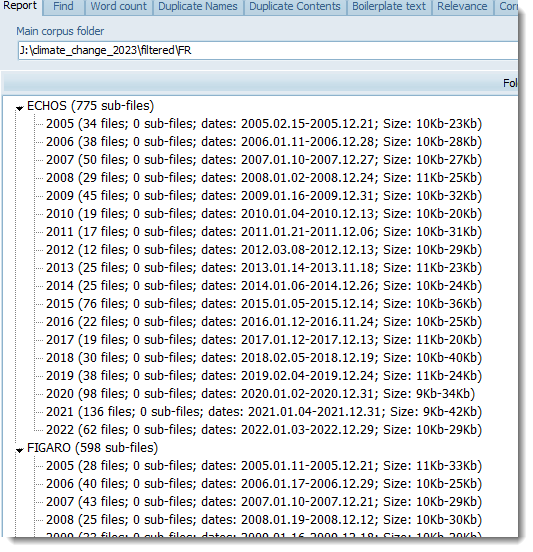
The data has the name of each sub-folder with an indication of how many files it has in it. It also stores the first file-date and last for each sub-folder, and the range of file-sizes.
This function lets you save your data as a text file in two formats:
•as a list
•as a table
 Save as List
Saved as a List you get the same data in the same format saved to the clipboard (paste it into a word processor) and optionally in a spreadsheet.
|
Save as Table
Saved as table will builds a rectangular matrix of rows and columns. Columns are the sub-folder names, rows have details for each folder. You'll be asked which details of the data you want to include:
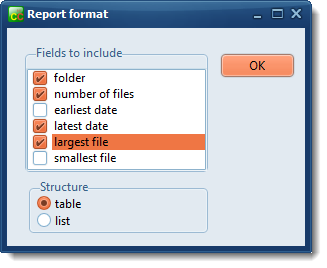
Here I saved the name of each folder, how many files are in it, the latest date and the largest file-size.
It will order the columns in alphabetical order. In spreadsheet format it would look like this:
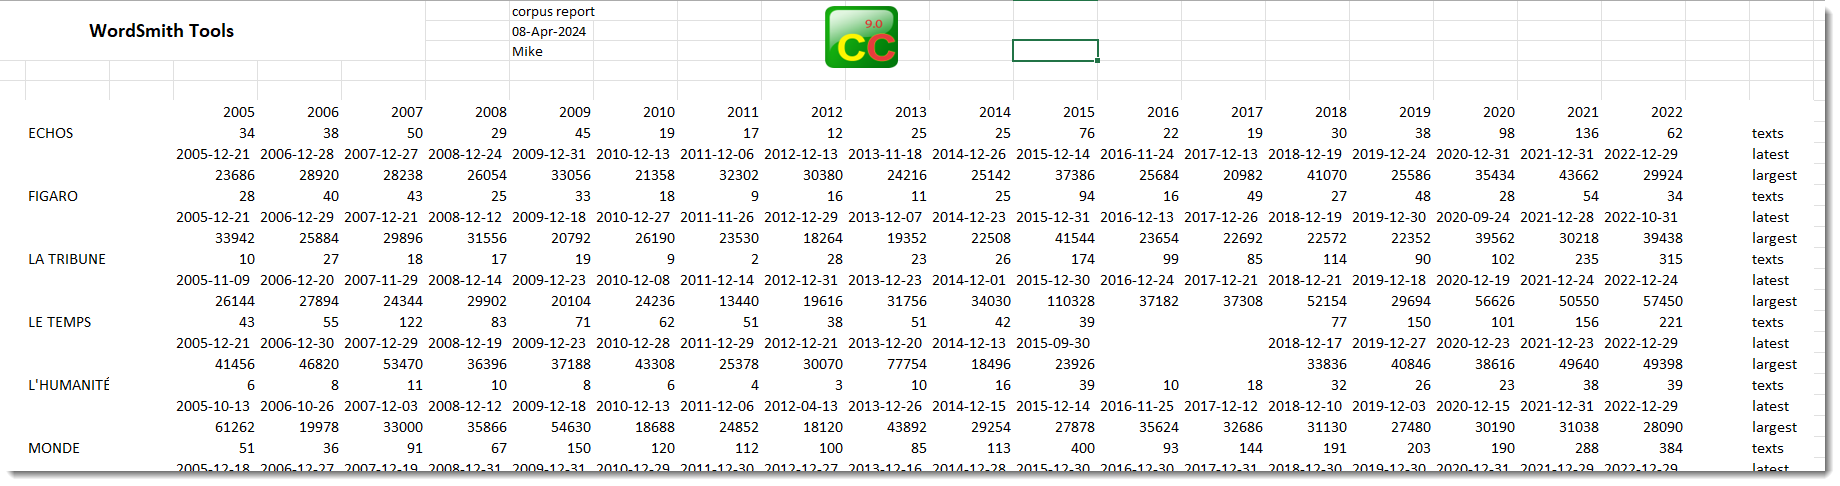
Table format makes it clear where a sub-folder is empty, as in the case of LE TEMPS data for 2016 and 2017 here.
|