Key Words Plot Display

Contents
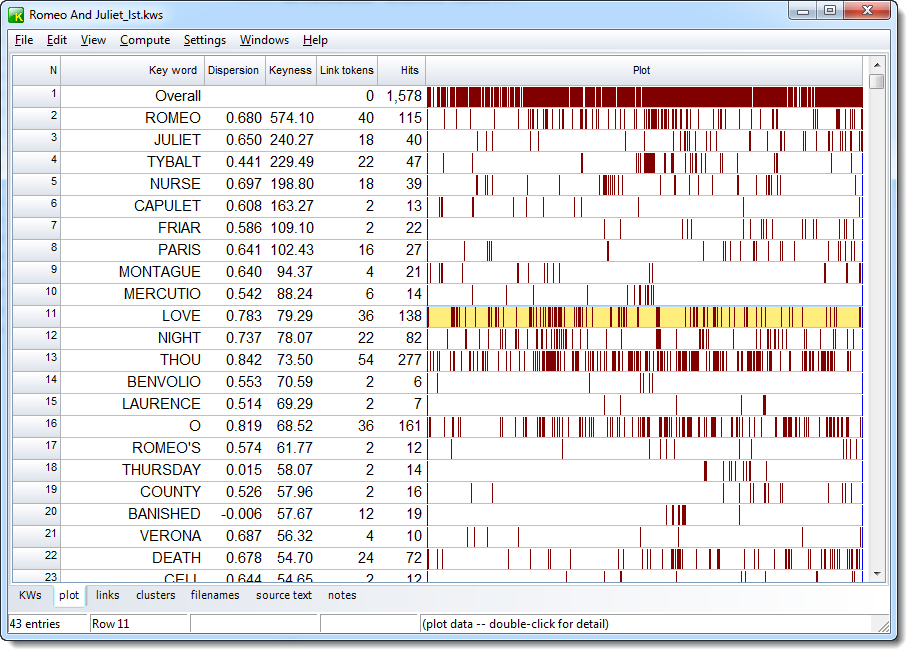
The plot will give you useful visual insights into how often and where the different key words crop up in the text. The plot is initially sorted to show which crop up more at the beginning (e.g. in the introduction) and then those from further in the text.
The following screenshot shows KWs of the play Romeo and Juliet, revealing where each term occurs. The name Tybalt, for example, occurs in a main burst about half way through the text.
re-sorting
Click the header to re-sort the listing or use the menu ![]() option. The Key word column sorts alphabetically, the dispersion column sorts on the amount of dispersion (higher numbers mean the occurrences are more spread out); the keyness column is the original plot order, or you can sort on number of links with other KWs or on the number of hits found.
option. The Key word column sorts alphabetically, the dispersion column sorts on the amount of dispersion (higher numbers mean the occurrences are more spread out); the keyness column is the original plot order, or you can sort on number of links with other KWs or on the number of hits found.
plot data
You can view the plot data as numbers by double-clicking. Here is the view if one double-clicks on the yellow area:
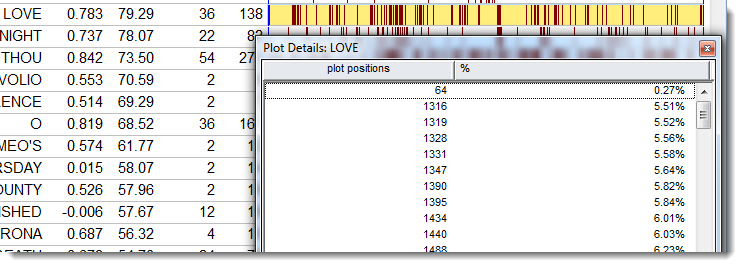
The first column gives the word-numbers and the second the percentage of the way through the text. Right-click on this window to copy or print.
links
This shows the total number of links between the key-word and other key-words in the same text, within the current collocation span (default = 5,5). That is, how many times was each key-word found within 5 words of left or right of any of the other key-words in your plot.
hits
This column is here to remind you of how many occurrences there were of each key-word.
When you have obtained a plot, you can then see the way certain words relate to others. To do this, look at the Links window in the tabs at the bottom, showing which other key words are most linked to the word you clicked on. That is, which other words occur most often within the collocation horizons you've set. The Links window should help you gain insights into the lexical relations here.
Each plot window is dependent on the key words listing from which it was derived. If you close that down, it will disappear. You can Print it. There's no Save option because the plot comes from a key words listing which you should Save, or Save As. There's no save as text option because the plot has graphics, which cannot adequately be represented as text symbols, but you can Copy to the clipboard (Ctrl+C) and then paste it into a word processor as a graphic. Alternatively, use the Output | Data as Text File option, which saves your plot data (each word is followed by the total number of words in the file, then the word number position of each occurrence).
The ruler in the menu (![]() ) allows you to see the plot divided into 8 equal segments if based on one text, or the text-file divisions if there is more than one.
) allows you to see the plot divided into 8 equal segments if based on one text, or the text-file divisions if there is more than one.
See also: Key words plot, plot dispersion value