Key Words display

Contents
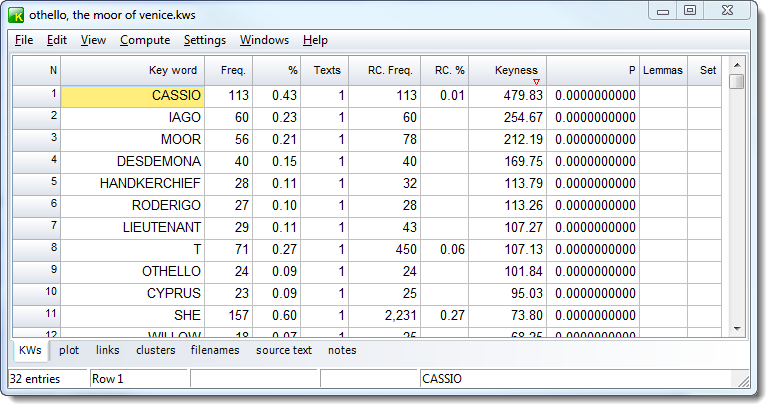
The display shows
•each key word
•its frequency in the source text(s) which these key words are key in. (Freq. column below)
•the % that frequency represents
•the number of texts it was present in
•its frequency in the reference corpus (RC. Freq. column)
•the reference corpus frequency as a %
•keyness (chi-square or log likelihood statistic)
•lemmas (any which have been joined to each other)
•the user-defined set
The calculation of how unusual the frequency is, is based on the statistical procedure used. The statistic appears to the right of the display. If the procedure is log likelihood, or if chi-square is used and the usual conditions for chi-square obtain (expected value >= 5 in all four cells) the probability (p) will be displayed to the right of the chi-square value.
The criterion for what counts as "outstanding" is based on the minimum probability value selected before the key words were calculated. The smaller the number, the fewer key words in the display. Usually you'll not want more than about 40 key words to handle.
The words appear sorted according to how outstanding their frequencies of occurrence are. Those near the top are outstandingly frequent. At the end of the listing you'll find any which are outstandingly infrequent (negative keywords), in a different colour.
There is no upper limit to the keyness column of a set of key words. It is not necessarily sensible to assume that the word with the highest keyness value must be the most outstanding, since keyness is computed merely statistically; there will be cases where several items are obviously equally key (to the human reader) but the one which is found least often in the reference corpus and most often in the text itself will be at the top of the list.
Source text
As its name suggests, choosing the source text tab gets you to a view of the source text(s).