Save as Text ( )
)

Contents
The point of it…
Save as Text means save your data as a plain text file (as opposed to the WordSmith format for retrieving the data another day). It is usually quicker to copy selected text into the clipboard, e.g. if you simply want to insert your results into your word processor.
If you want to copy the data in colour, you should definitely use the clipboard.
In the case of a concordance, if you want only the words visible in your concordance line (not the number of characters mentioned below), use the clipboard and then Paste or Paste Special in graphics format.
How to do it
This function can be reached by Save As .. | Plain text (![]() ), XML text (
), XML text (![]() ), Excel spreadsheet (
), Excel spreadsheet (![]() ) or Print to File (via F3 or
) or Print to File (via F3 or ![]() ) or Copy (
) or Copy (![]() ) to text file.
) to text file.
Options include:
header |
words you want to save at the start of the data (leave blank if not wanted); |
numbered |
whether the numbers visible in the column at the left are saved too |
column separator |
by default a tab but you can specify something else to go between visible columns |
rows |
all/any which you have highlighted/a specific range, e.g. 1-10, 5-, -3 |
columns |
all/any which you have highlighted/a specific range (column 1 is the one with the numbers) |
You can then easily retrieve the data in your spreadsheet, database, word-processor, etc. (If you want to use it as a table in a word processor, first save as text, then in your word-processor choose the Convert Text to Table option if available. Choose to separate text at tabs.)
Note: The Excel spreadsheet (![]() ) save will look something like this:
) save will look something like this:
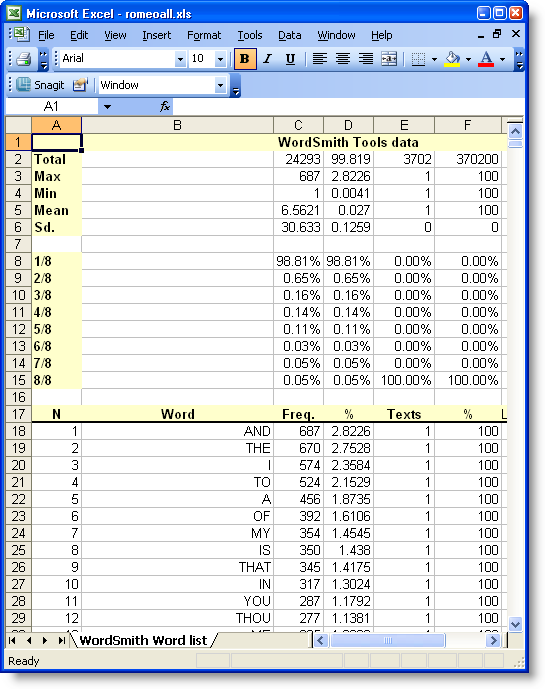
The words are visible from row 18 onwards; above them we get some summary data. The 1/8, 2/8 etc. section splits the data into eighths; thus 100% of the Texts data (column E) is in the 8th section, whereas nearly all the data (98.8%) are in the smallest section in terms of word frequency, because so many words come once only. You'll be asked whether to compute this summary data if you choose to save as Excel.
In the case of a concordance line, saving as text will save as many "characters in 'save as text'" as you have set (adjustable in the Controller Concord Settings). The reason for this is that you will probably want a fixed number of characters, so that when using a non proportional font the search-words line up nicely. See also: Concord save and print.
Each worksheet can only handle up to 65,000 rows and 256 columns. If necessary there will be continuation sheets.
If your data contains a plot you will also get another worksheet in the Excel file, looking like this.
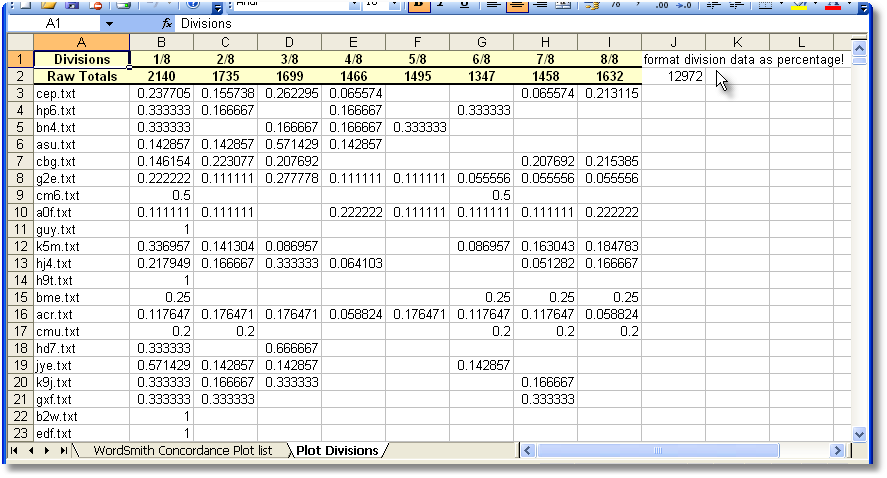
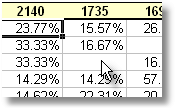
The plot data are divided into the number of segments set for the ruler (here they are eighths), and the percentage of each get put into the appropriate columns. That is, cell B3 means that 23.7% of the cep.txt data come in the first eighth of the text file. Set the format correctly as percentages in Excel, and you will see something like this:
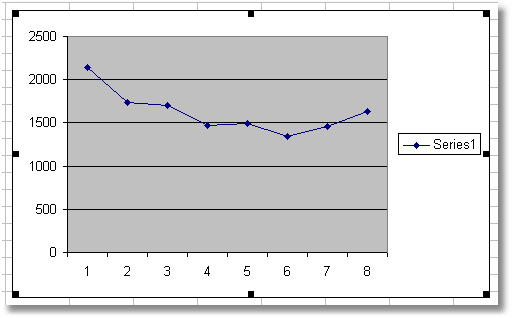
At the top you get the raw data, which you can use Excel to create a graphic with.
If you want access to the details of the plot, choose save as text. The results will look like this:
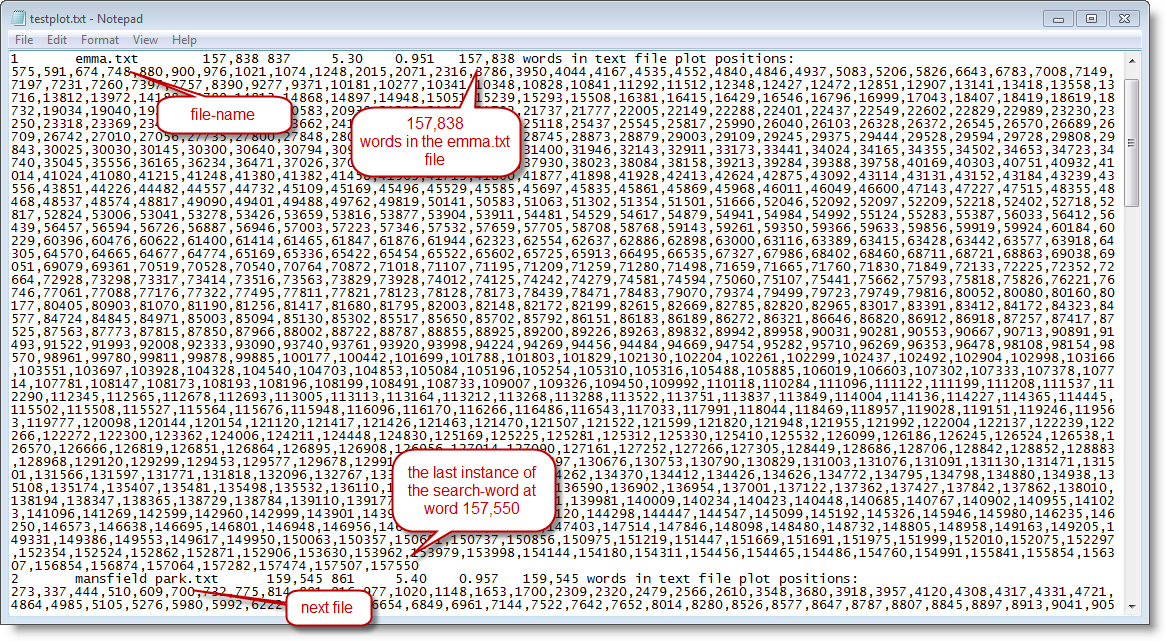
and you can then process those numbers in another program of your choice.
In the case of XML text (![]() ), you get a little .HTM file and a large .XML file. Click on the .HTM file and you can see your data a page at a time, with buttons to jump forwards or back a page, as well as to the first and last pages of data. This accesses your .XML file to read the data itself.
), you get a little .HTM file and a large .XML file. Click on the .HTM file and you can see your data a page at a time, with buttons to jump forwards or back a page, as well as to the first and last pages of data. This accesses your .XML file to read the data itself.
See also: Excel Files in batch processing